
Best practices
-
-
Introduction to Helm for Kubernetes
Explore core concepts, features, and benefits for DevOps, with a practical workflow example to simplify deployments and boost efficiency.

Effective monitoring and log management are important for maintaining robust infrastructure and applications. Grafana , Loki , and Alloy are open source tools you can use to create a comprehensive logging stack and simplify how you collect, store, and visualize log data. In this logging stack, Grafana offers a flexible platform for visualizing metrics and logs, Loki works as the log-aggregation system, and Alloy is the agent that collects and forwards logs to Loki.
While you can deploy these tools in Kubernetes using several YAML files, such as deployment.yaml and services.yaml, you'd need to update these files every time you need to change the configuration. Helm , a Kubernetes package manager, simplifies this process by enabling consistent installations, version control, and template parameterization. Helm's chart-based approach encapsulates application components and configurations, making complex deployments easier. To streamline your Kubernetes logging, using individual charts for each tool is considered best practice for you to scale each component independently.
In this article, you'll learn how to set up a complete logging stack using Helm. You'll configure Loki to use AWS S3 as a storage backend, deploy Alloy to collect logs, and integrate Grafana for effective log visualization.
Here's an overview of the logging stack you're going to set up with Loki, Grafana, and Alloy using Helm:
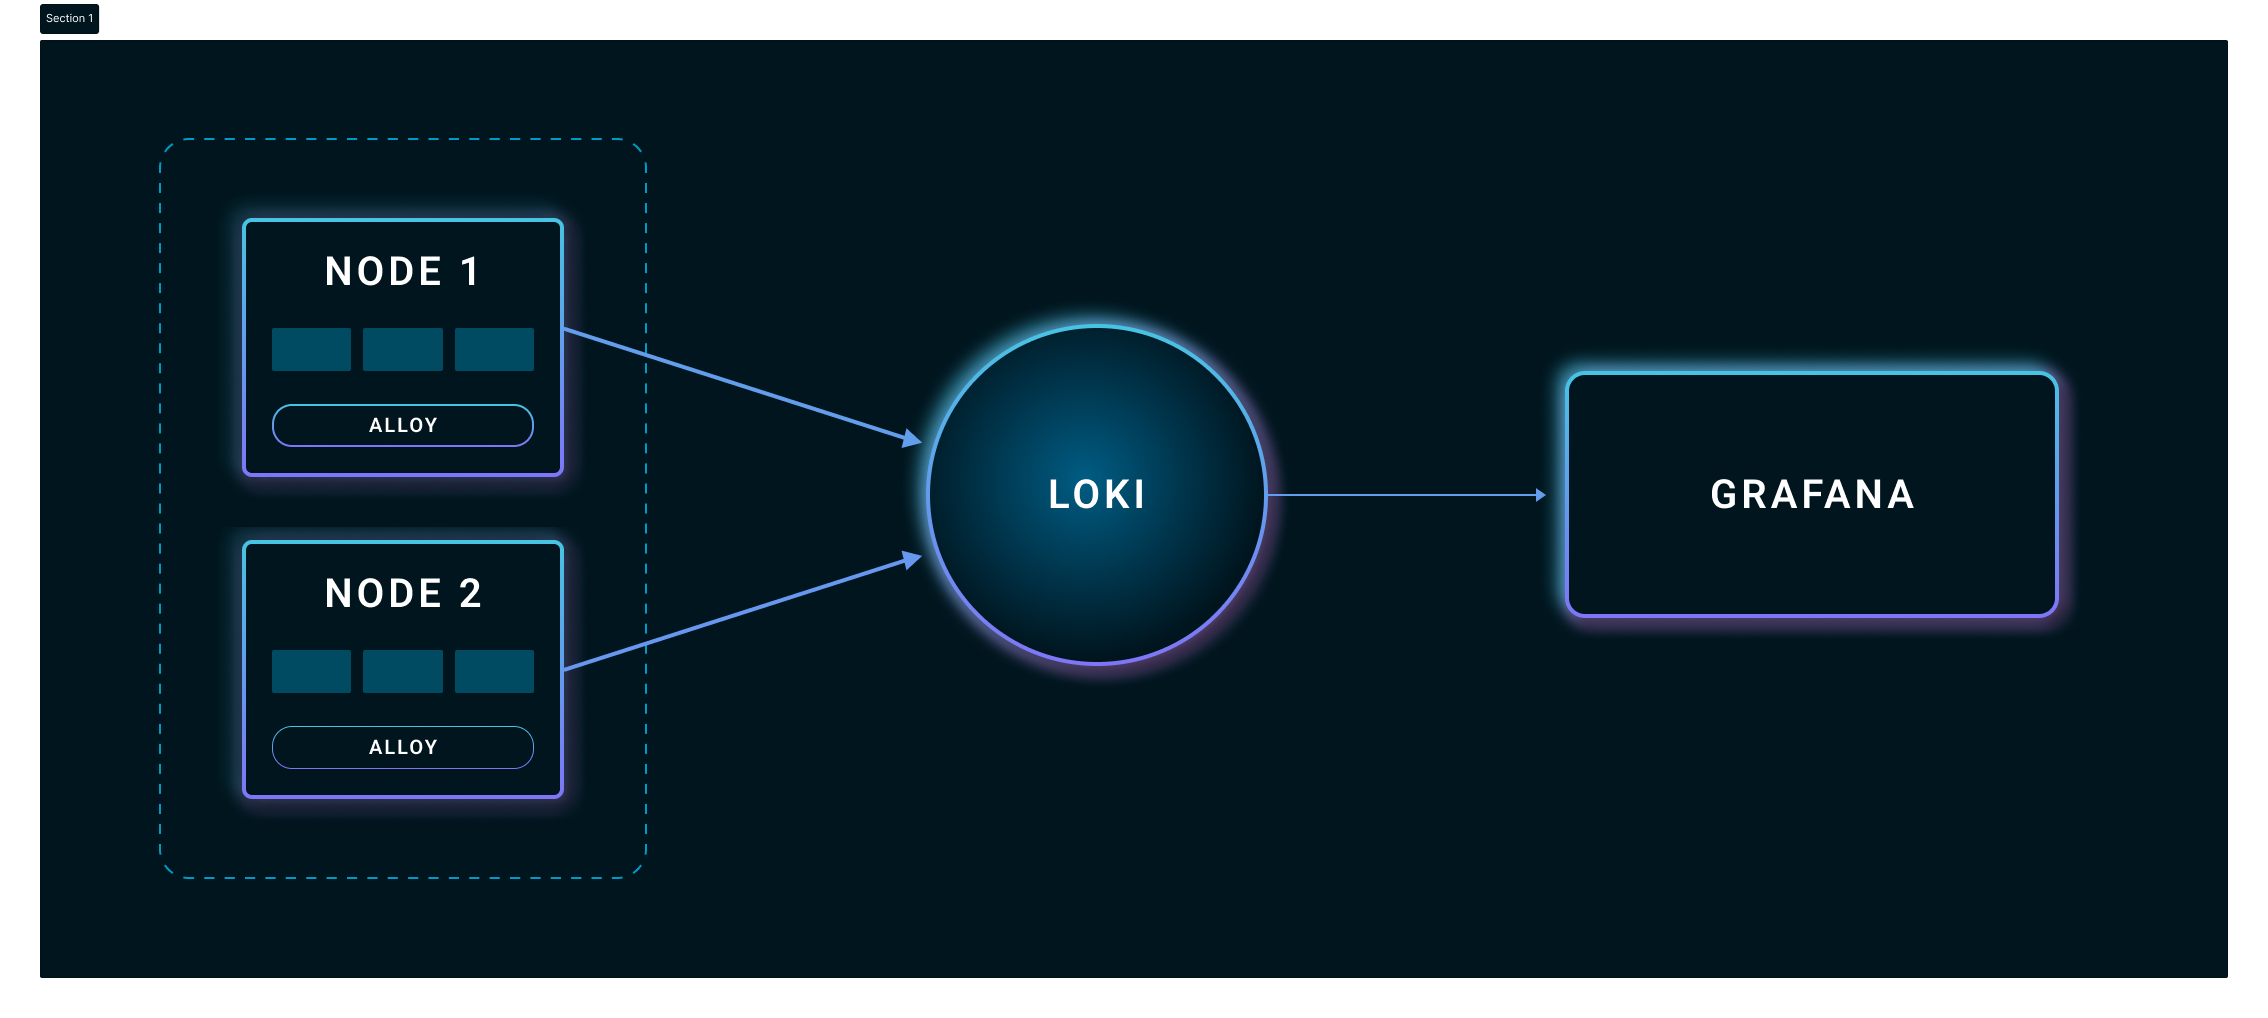
Alloy works as a log collector and shipper. It's designed to replace multiple log collection tools like Promtail, Fluentd, Fluent Bit, and OpenTelemetry collectors. It gathers logs from sources like log files, Kubernetes pods, and systemd journals. It then processes them, for example, by filtering and labeling them, before sending the data to Loki.
Loki here serves as a log aggregator and storage system. It collects all the logs from Alloy, organizes them into streams based on labels, and then stores them. Finally, Grafana is the visualization and analytics tool in this stack. It integrates with Loki to get the logs and then displays these logs in an intuitive interface. With Grafana, you can create dashboards to monitor system performance, search logs with the help of queries, and set up alerts based on the log data.
Before starting, you'll need the following:
kube-dns service name. Modern Kubernetes (v1.13+) uses CoreDNS internally but usually keeps the kube-dns name for compatibility. Verify this service exists in your cluster, as configurations may differ by distribution.
Let's start by setting up the Kubernetes environment to install Grafana, Loki, and Alloy using Helm. You need to add the necessary Helm repositories and then configure the values.yaml files for each component to ensure compatibility and stability. Each configuration in this section might require you to run some commands, so keep your command prompt or terminal open.
The Grafana Helm repository contains the charts for Grafana, Loki, and Alloy, simplifying their deployment and management within Kubernetes environments.
To add the charts to your Kubernetes environment, run the following command in your terminal:
You also need to update the Helm repository to ensure that you have the latest versions of these charts. This is especially useful if there have been recent updates to the charts. You can do so with the following command:
While you can work in the default Kubernetes namespace, creating a dedicated namespace for your logging stack will allow you to better organize and isolate its components. This separation helps manage resources more effectively and prevents potential conflicts with other applications. Use the following command to create a dedicated namespace:
You need to provide AWS credentials for Loki to access the S3 storage. These credentials can be provided by configuring a Kubernetes secret or mounting IAM roles if you're on AWS EKS. For this article, you can create a Kubernetes secret with your AWS access key and secret as follows:
To follow this tutorial, you'll need to clone the following repository to your local machine using Git:
Within the cloned repository, you'll find the file loki-helm-settings.yaml. This file overrides the default configurations found in Loki's upstream values.yaml file, allowing for tailored deployment. While you could proceed with deploying Loki using this configuration immediately, it's important to understand the rationale behind these customizations.
Loki, by its nature, can be a resource-intensive application, particularly under heavy log ingestion loads. Therefore, the loki-helm-settings.yaml file incorporates specific adjustments to optimize resource consumption for this tutorial environment. The following sections explain the key configurations within this file, explaining the "why" behind each modification to ensure a more efficient and manageable Loki deployment.
The first important change in loki-helm-settings.yaml involves how Loki organizes its data. This is set in the schema configuration. Here’s the relevant part from the configuration file:
This setup uses TSDB (Time Series Database) to store logs in Loki, replacing the older boltdb-shipper method. TSDB is more efficient at handling large volumes of log data and supports faster searches, making it a better option for systems with high log ingestion rates.
In the limits_config section, you'll see relatively high initial values for max_query_parallelism, ingestion_rate_mb, and ingestion_burst_size_mb. These settings control how many searches can run at the same time and how quickly Loki can receive new logs. If these values are too low, they can slow things down, especially when Alloy starts sending logs to Loki. Since Alloy can send a large number of logs, this example sets higher initial limits to help Loki handle the incoming data more efficiently.
Keep in mind that these limits_config values will need careful tuning based on your specific needs and the resources of your Kubernetes cluster. The initial values here are a starting point to avoid bottlenecks with Alloy.
With Loki, the compactor is responsible for several background tasks that optimize Loki's storage and query efficiency. These tasks include compacting smaller chunks of data into larger, more manageable ones, which reduces the number of files Loki needs to query and improves performance. The compactor also handles the deletion of old data based on the configured retention period, ensuring that your storage costs don't grow indefinitely.
Here is the compactor configuration section from our loki-helm-settings.yaml file:
For this tutorial, the Compactor's retention functionality has been disabled by setting retention_enabled to false. This is primarily to conserve Kubernetes resources. In a production environment, you would typically enable this to allow Loki to automatically manage the deletion of old logs based on the retention_period we configured earlier.
The compaction_interval setting determines how frequently the Compactor will run its optimization tasks. In this configuration, it is set to 2h, meaning the Compactor will attempt to compact log chunks every two hours. The working_directory specifies the local file system path where the Compactor stores temporary data during its operations. If you were to enable persistence for Loki, it would be essential to ensure this directory has write access.
In loki-helm-settings.yaml, you'll notice that the resources block, including requests and limits for CPU and memory, is commented out. This is a deliberate choice for this initial deployment in our tutorial environment.
The intention here is to ensure Loki can start up reliably and handle the initial log flow from Alloy without encountering "Out of Memory" (OOM) errors or CPU throttling, which could lead to instability. Once Loki is successfully deployed and you have a better understanding of its resource consumption patterns in your specific use case, you should uncomment and adjust these requests and limits accordingly.
Remember to start with relatively high values based on your anticipated log volume and then fine-tune them through observation and testing.
Now that you've addressed key performance-related settings for Loki, let's examine how you configure its data storage. Using AWS S3 for Loki's data offers better scalability, durability, and cost efficiency compared to local Kubernetes storage. S3 allows for horizontal scaling and provides built-in data redundancy.
This example configures the loki-helm-settings.yaml to use an S3 bucket. Here's what you need to know:
bucket_name is set to loki-tutorial. Remember to change this to the name of your S3 bucket.us-east-1. Change it to match the region of your AWS bucket.aws-credentials created earlier. The loki-helm-settings.yaml file uses extraArgs and extraEnv to securely pass these credentials to Loki's Backend, Read, and Write components, enabling access to your S3 bucket.
Now that Loki is set up, you can deploy Grafana to visualize the log data it collects. To do this, you set up basic credentials, configure the Loki data source, define access settings, and manage resource allocations.
Grafana requires an admin username and password, which ensures that only authorized people have access to the Grafana dashboard. You set these admin credentials in the grafana-helm-settings file as follows:
Replace YourSecurePassword! with a secure password for your Grafana admin account. For this tutorial, you can use the default username admin.
To visualize logs from Loki in Grafana, you need to set Loki as a data source. You can configure this data source in grafana-helm-settings.yaml to make Grafana connect to Loki automatically upon deployment:
Here, url points to the Loki service in the logging namespace, and isDefault makes Loki the default data source for Grafana. This setup lets you visualize and query logs in Grafana as soon as it's deployed.
To access Grafana's UI, you'll need to specify how the service should be exposed. Depending on your cluster setup, you can use NodePort or LoadBalancer as the service type:
LoadBalancer is suitable for environments where you want Grafana accessible externally, often through cloud providers. On the other hand, NodePort opens a port on each node in the cluster and routes external traffic to Grafana.
Similarly to Loki, after deployment, you need to define the requests and limits to allow Grafana to operate smoothly within the cluster without overloading its resources:
Grafana supports additional security configurations to protect data and manage access. While these features are not needed for this example, it's important to implement them when deploying Grafana in a production environment to safeguard access and protect sensitive data.
Some of these settings include the following:
For Alloy, the example takes a structured approach that uses a dedicated configuration file (alloy-settings.alloy) and a Kubernetes ConfigMap (alloy-settings) instead of directly editing Alloy's Helm values.yaml.
Centralizing the configuration in a separate file creates a clear separation between the "what" (how logs are processed and labeled) and the "how" (how Alloy is deployed in Kubernetes). This decoupling simplifies management, allows for easier version control of the labeling rules, and makes it easier to update Alloy's behavior by modifying the ConfigMap without having to change the Helm deployment. The alloy-helm-settings.yaml then cleanly references this ConfigMap, promoting a more organized and robust configuration strategy.
Alloy's configuration is defined using the Alloy configuration syntax (previously known as River configuration language). This declarative language establishes a data flow graph, outlining how data should be processed and where it should be sent. The alloy-settings.alloy file contains the configuration for our Alloy deployment:
This configuration defines how Alloy discovers and processes logs from your Kubernetes pods and then forwards them to Loki.
logging block sets the global logging level for Alloy to info and the format to logfmt.discovery.kubernetes "pods" component instructs Alloy to discover Kubernetes pods.discovery.relabel "kube_relabel" component enriches the logs with valuable metadata. It takes the targets discovered by discovery.kubernetes "pods" and applies a series of relabeling rules. These rules add standard Kubernetes labels like namespace, pod, container, and node_name to the log streams. It also preserves the __path__ label, which tells Alloy where to read the log files. Additionally, it explicitly adds an app label if the __meta_kubernetes_pod_label_app label exists on the pod, and then drops the original Kubernetes metadata label. This ensures our logs are well-labeled, making them easier to query and filter in Grafana.loki.source.kubernetes "kube_logs" component tails the log files from the pods based on the relabeled targets and forwards these logs to the loki.write.local_loki.receiver.loki.write "local_loki" component defines how Alloy communicates with Loki, specifying the URL of the Loki gateway service within our Kubernetes cluster.
ConfigMaps allow you to decouple environment-specific configuration from your containerized applications. In our case, we are using a ConfigMap to store the alloy-settings.alloy file, making it easily accessible by our Alloy pods.
This command creates a ConfigMap named alloy-settings in the logging namespace. The --from-file flag tells kubectl to read the content of the alloy-settings.alloy file and store it under the key config.alloy within the ConfigMap.
Now that you have created alloy-settings, you can configure the Alloy Helm deployment to use it. The alloy-helm-settings.yaml file contains the necessary overrides to achieve this:
Similar to the Loki configuration, the resources block for Alloy is commented out. This is to allow Alloy to start and operate without immediate resource constraints. Alloy's resource consumption will depend on the number of pods and containers it monitors. Once Alloy is running and you have observed its resource usage, you need to uncomment and adjust the requests and limits to ensure efficient resource allocation and prevent potential instability in your cluster. Start with the provided example values as a baseline and fine-tune them based on your specific workload.
Now it's time to deploy Loki, Alloy, and Grafana using Helm.
To deploy Loki with Helm, you use the customized loki-helm-settings.yaml file that you configured earlier. Run the following Helm command to deploy Loki:
You can deploy Alloy by running the following Helm command:
Finally, you can deploy Grafana using the grafana-values.yaml file with the following command:
To make sure that each component is deployed successfully, you can check the status of the pods and services within the logging namespace:
After running this command, the Loki, Alloy, and Grafana pods should show a "Running" status, indicating they have started successfully.
With the logging stack deployed, you can now access the Grafana UI and start querying logs from Loki.
To access the Grafana user interface, you'll need to determine the external IP address assigned to the Grafana service. You can retrieve this information by executing the following kubectl command:
Monitor the output of this command until an IP address is listed under the EXTERNAL-IP column. This process might take a few minutes as your cloud provider provisions the necessary resources. Once the external IP is available, copy it.
You can now access the Grafana UI by opening http://<EXTERNAL-IP> in your web browser, replacing <EXTERNAL-IP> with the address you just copied.
To log in to Grafana, use the username admin and the password that you configured in the grafana-helm-settings.yaml file during the Grafana deployment.
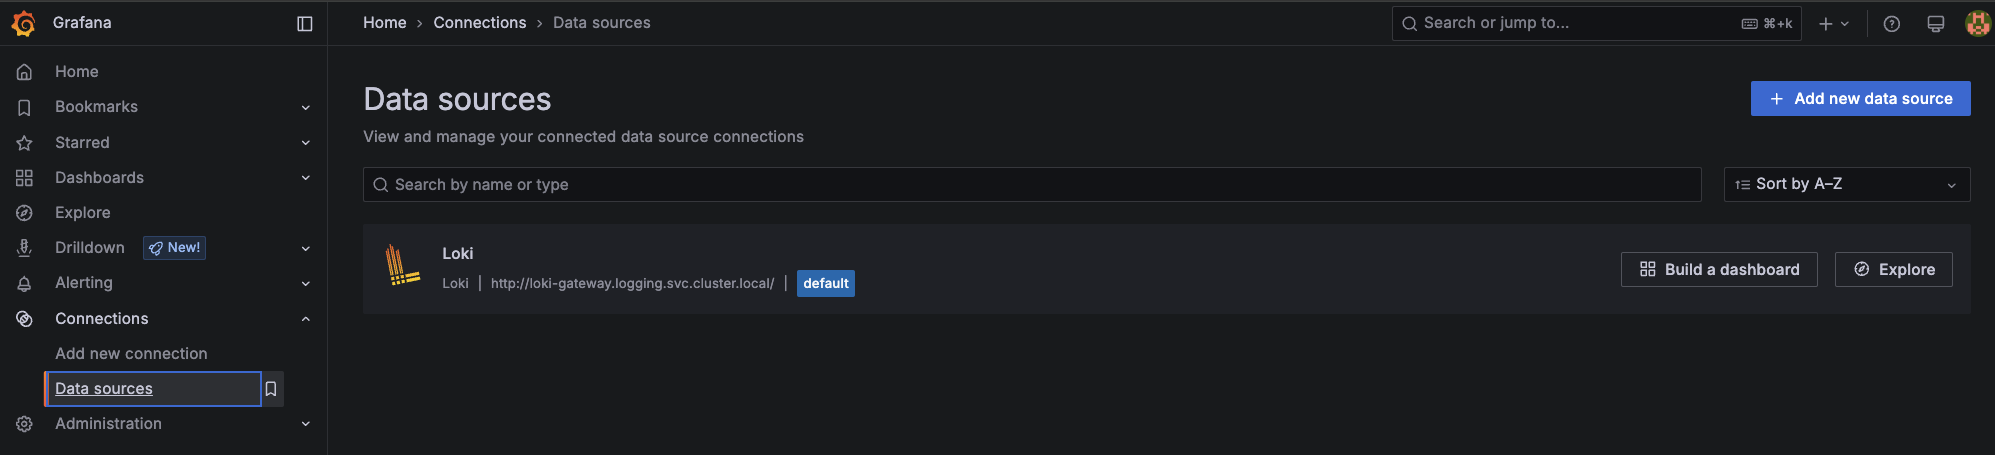
After successfully logging in, you should verify that the Loki data source has been correctly configured. Navigate to Connections in the left-hand menu, then select Data sources. You should see an entry named "Loki" listed, indicating that Grafana is properly configured to communicate with your Loki instance.
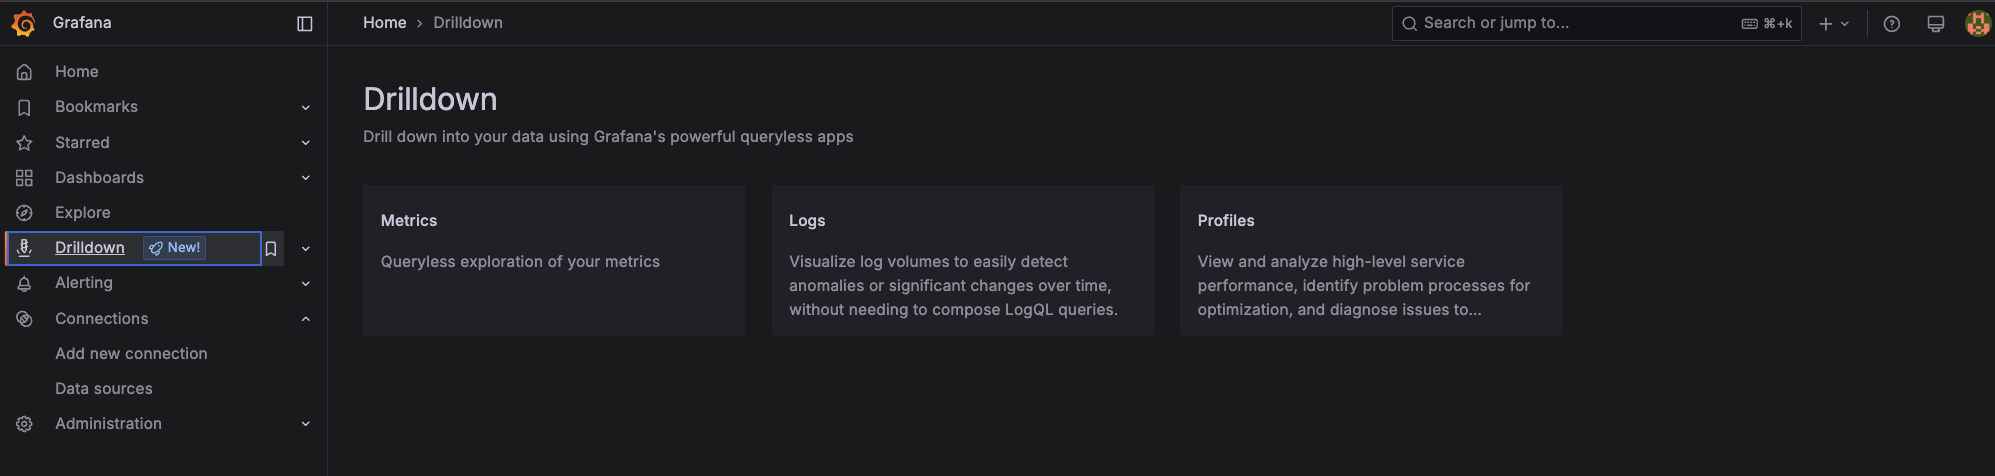
You have two options to start exploring Kubernetes logs: the legacy "Explore" screen or the new "Drilldown" view. Let's start with the latter.
Click Drilldown on the left-hand menu in Grafana. You can explore Metrics, Logs, and Profiles. Click on Logs.
Since you already configured Loki as the data source, you should start seeing some logs.
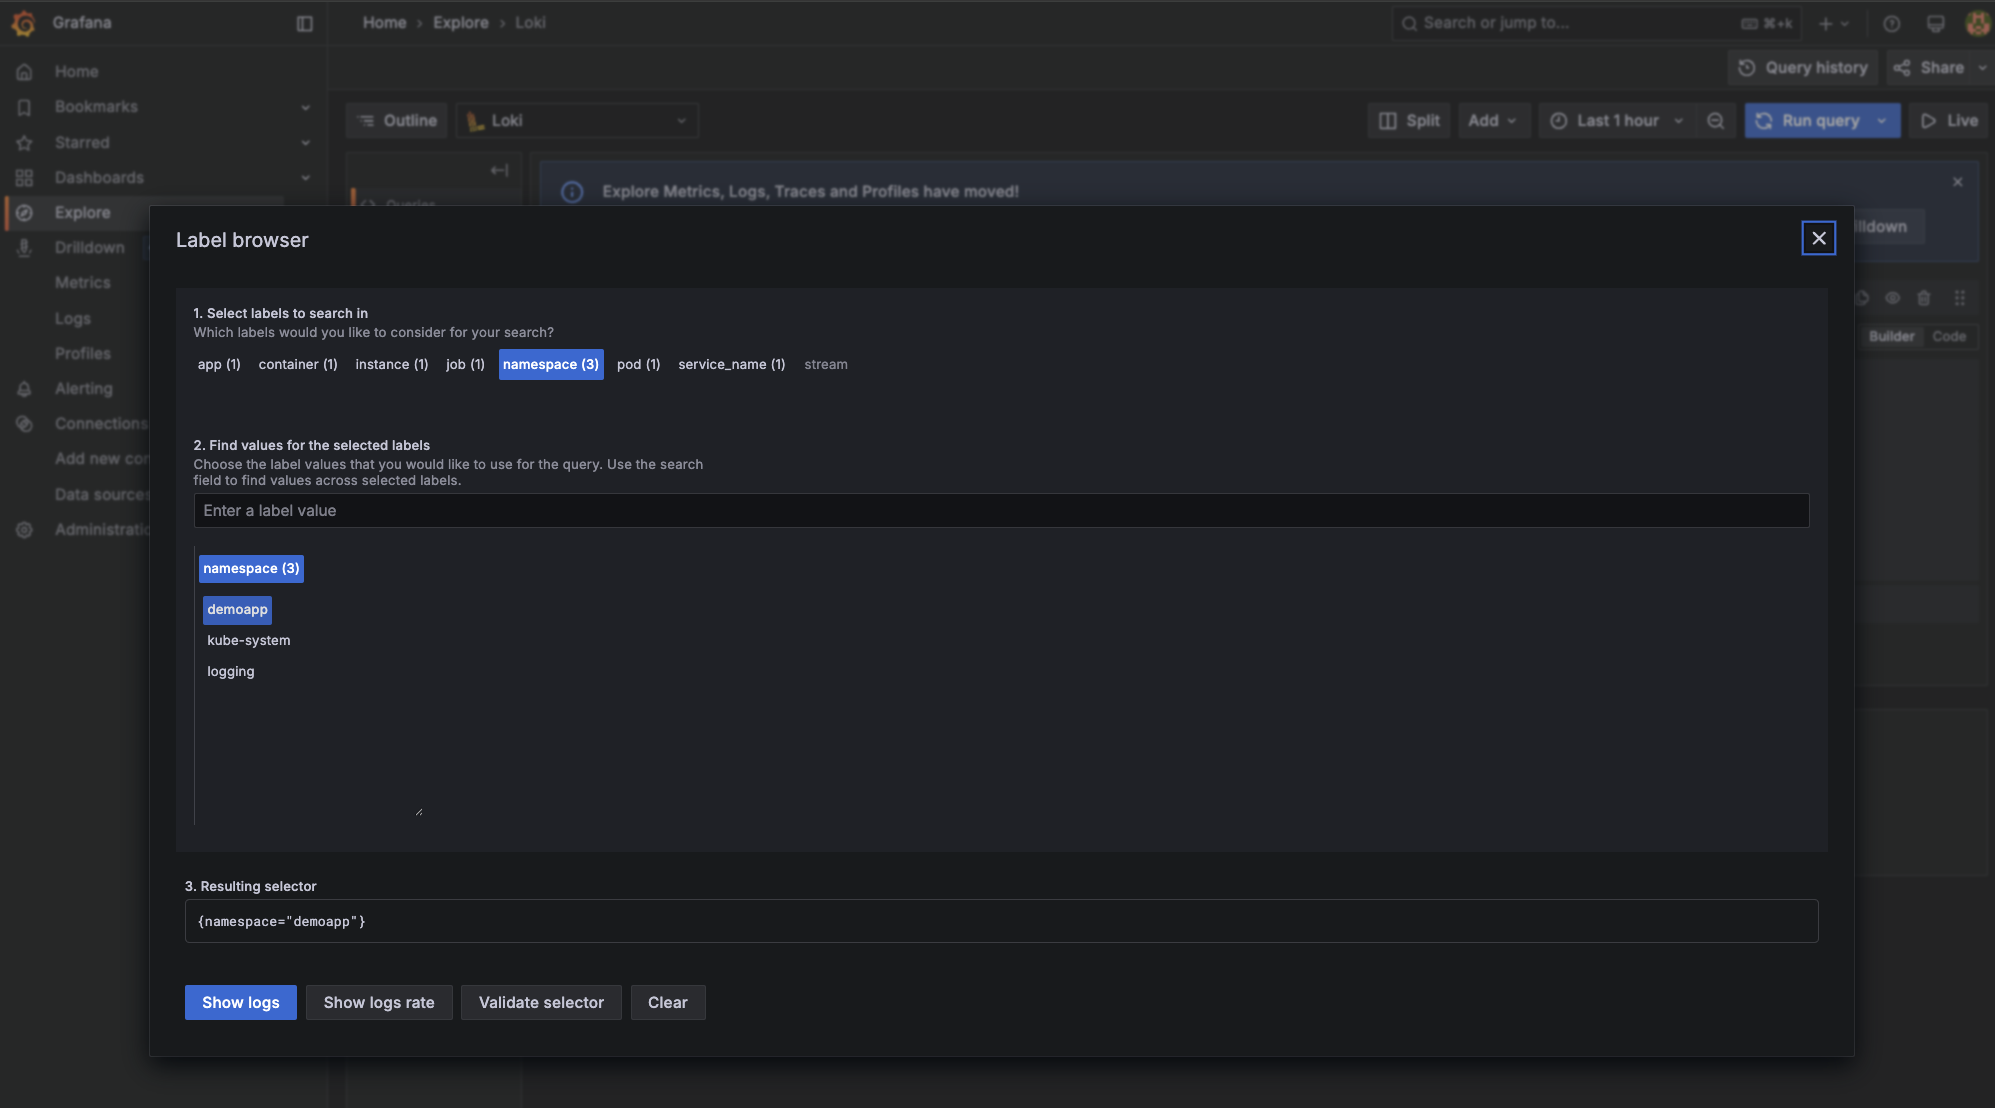
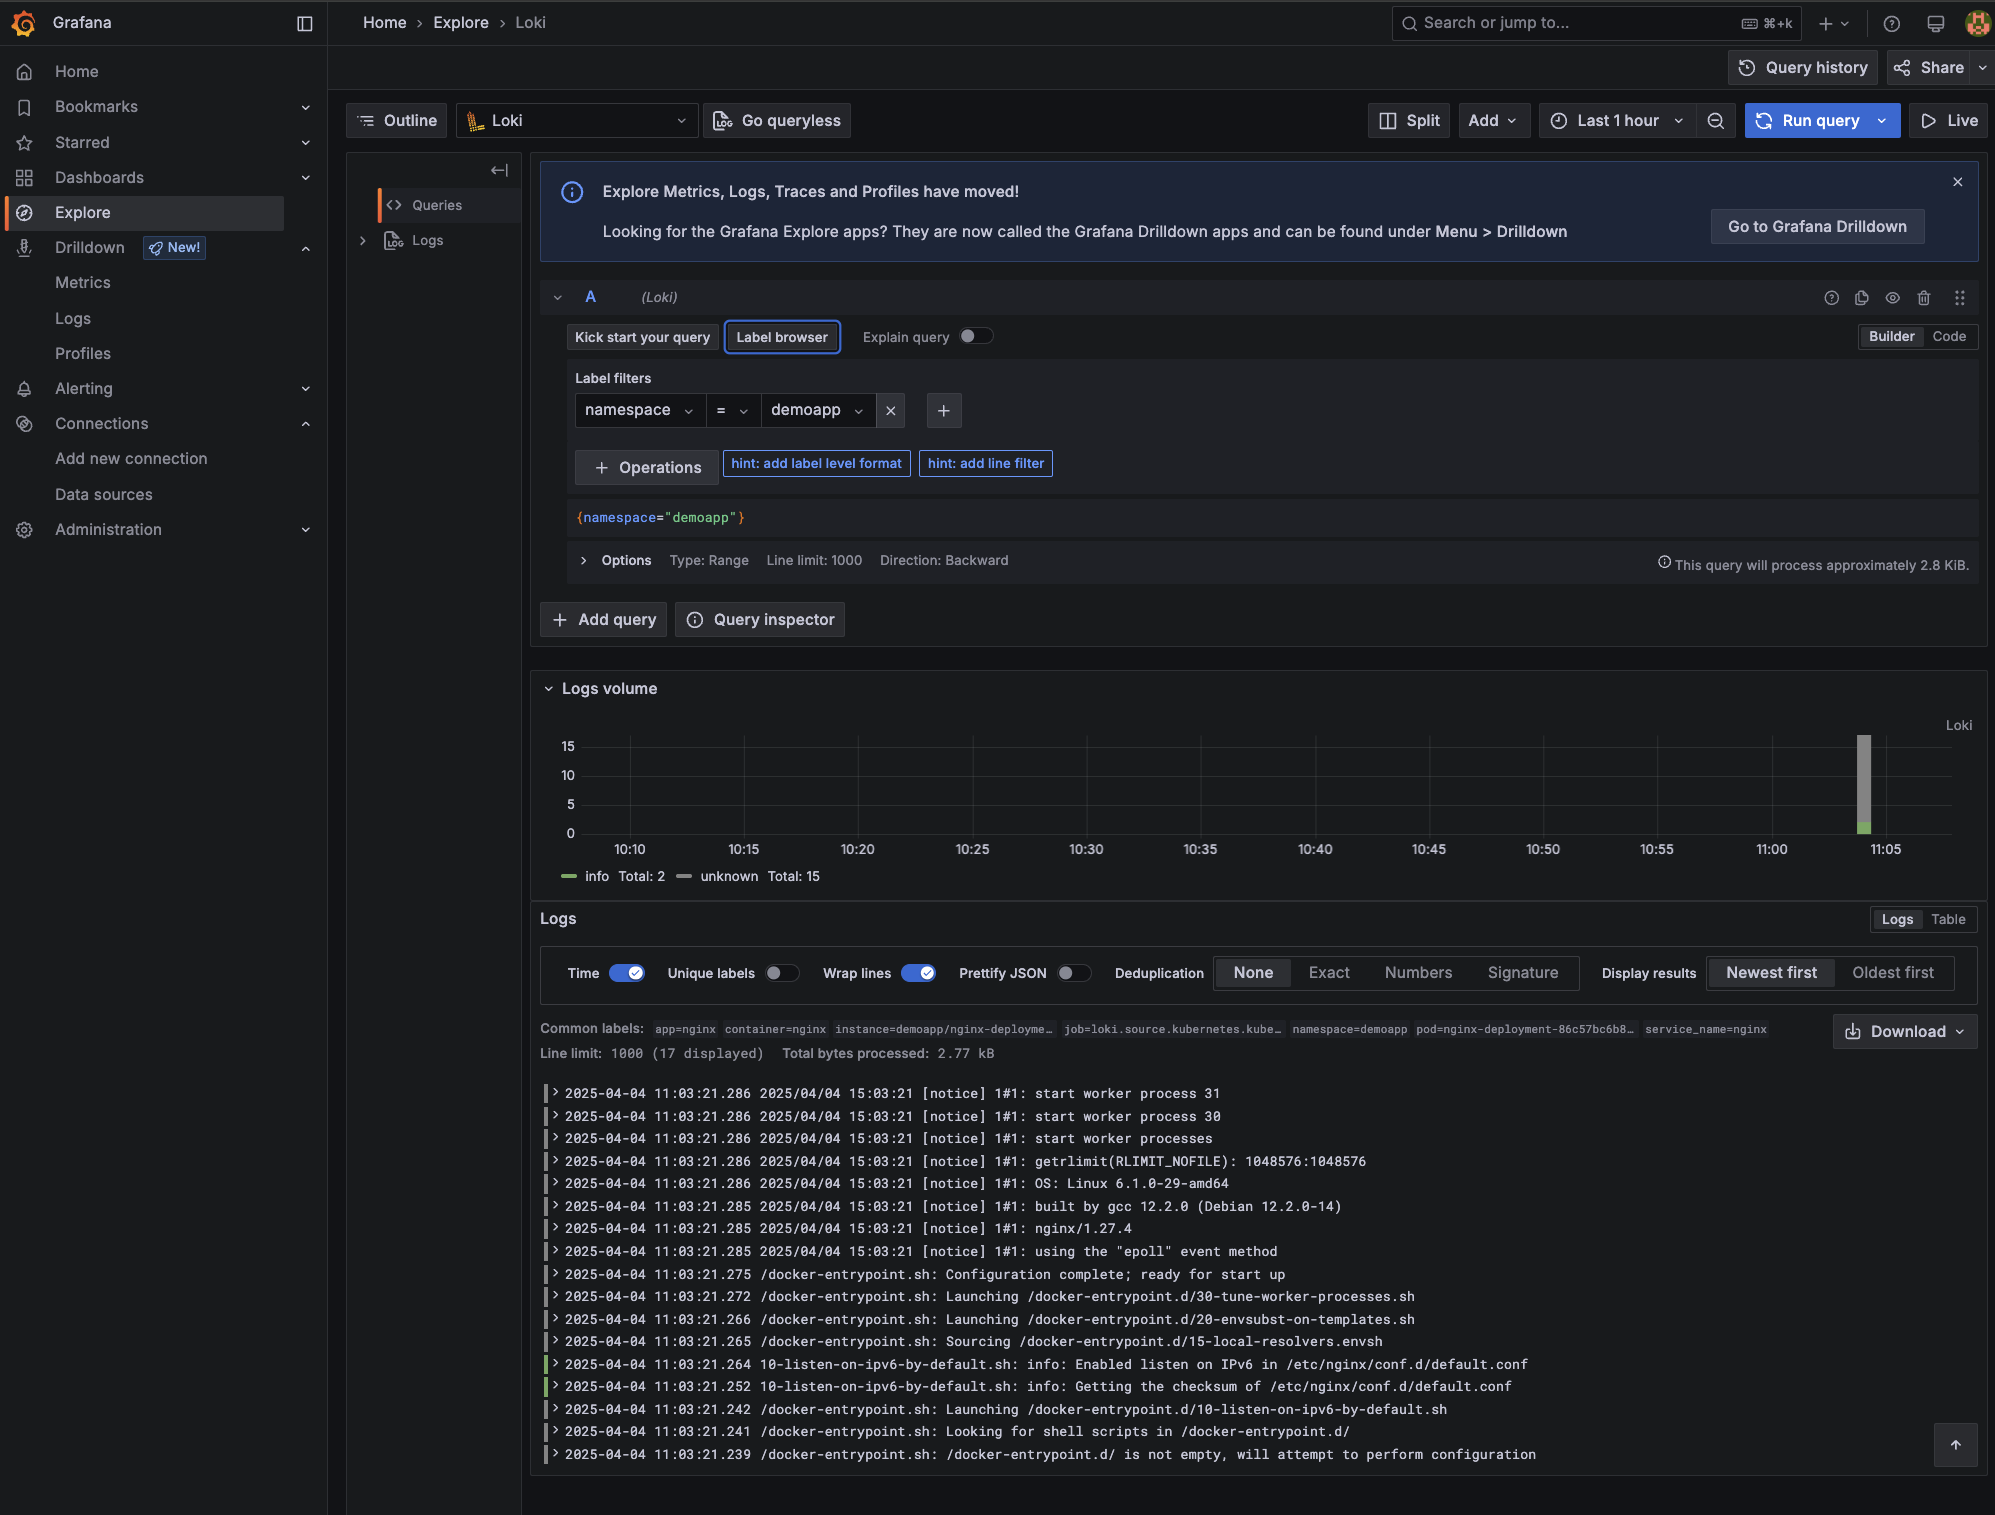
Alternatively, you can click Explore on the left-hand menu in Grafana. Here, you can use the Label browser as shown below:
To demonstrate some common log queries, let's deploy a simple Nginx pod that simulates a workload in Kubernetes and generates some logs, including error messages.
Deploy the workload as follows:
This will start an Nginx pod in the "demoapp" namespace, generating access logs that you can query through Grafana.
If you are still in the Label browser, you can select namespace and then use the filter dropdown to select demoapp.
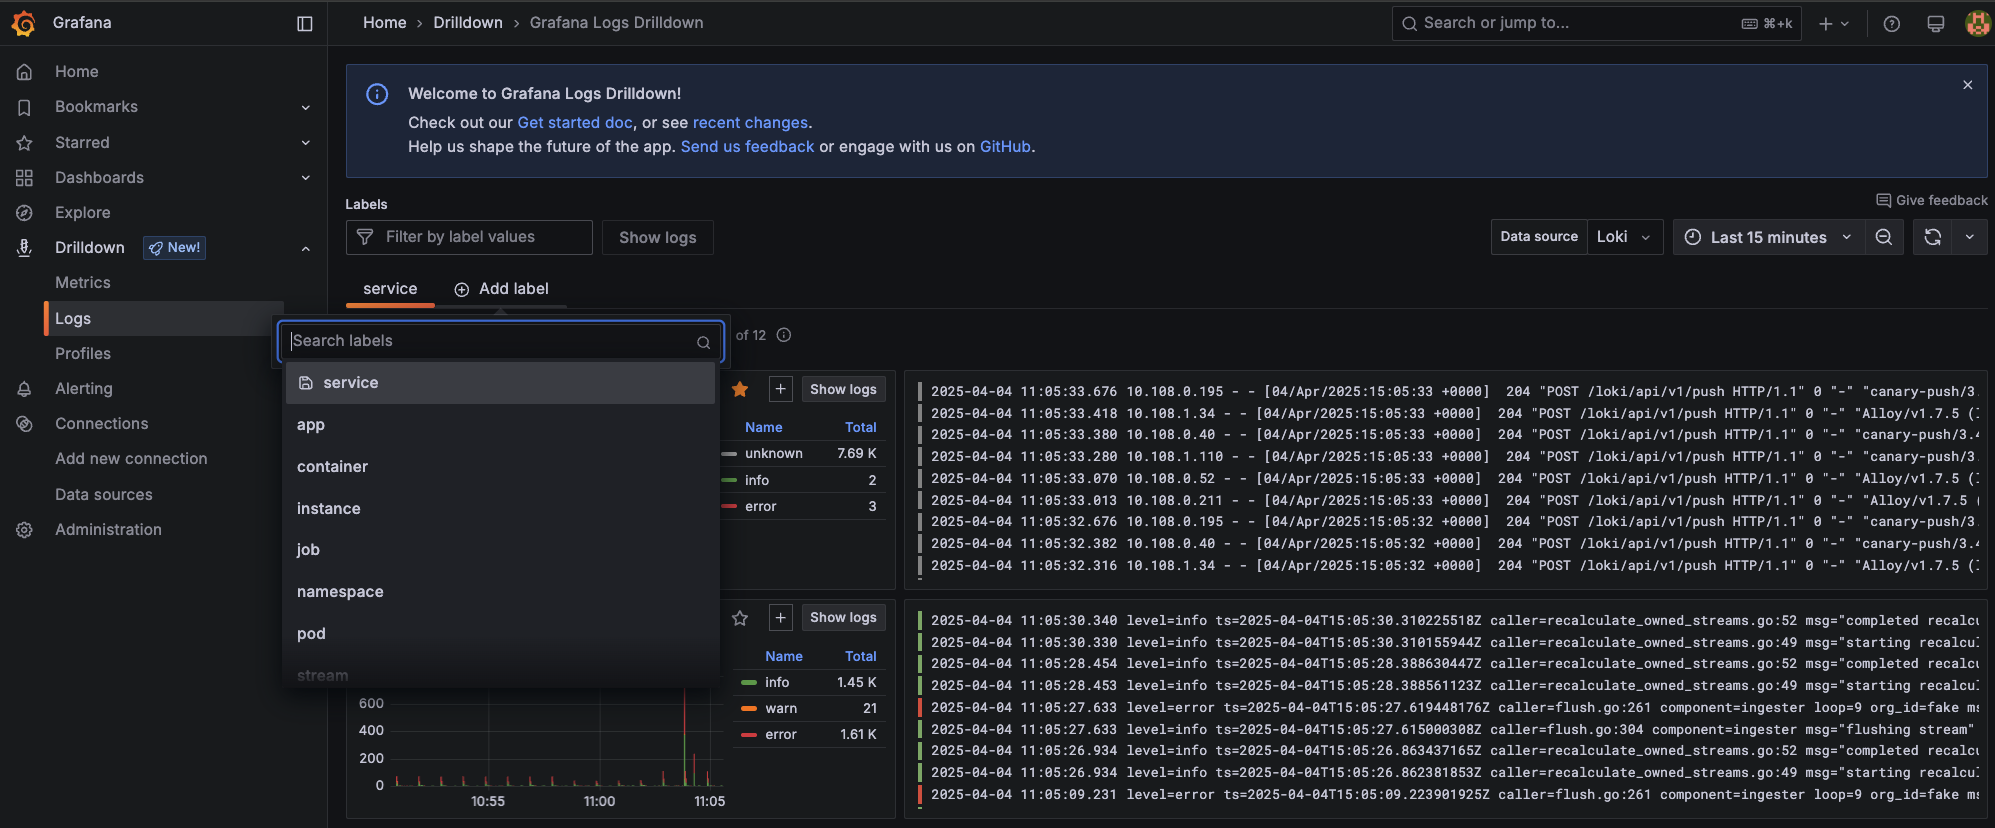
You can also try the new Drilldown view by navigating to Drilldown > Logs and then clicking Add label. Next, select a Kubernetes label defined in the Alloy configuration like app, container, instance, or namespace.
For example, if you add the label namespace a new tab will open with a screen similar to this:
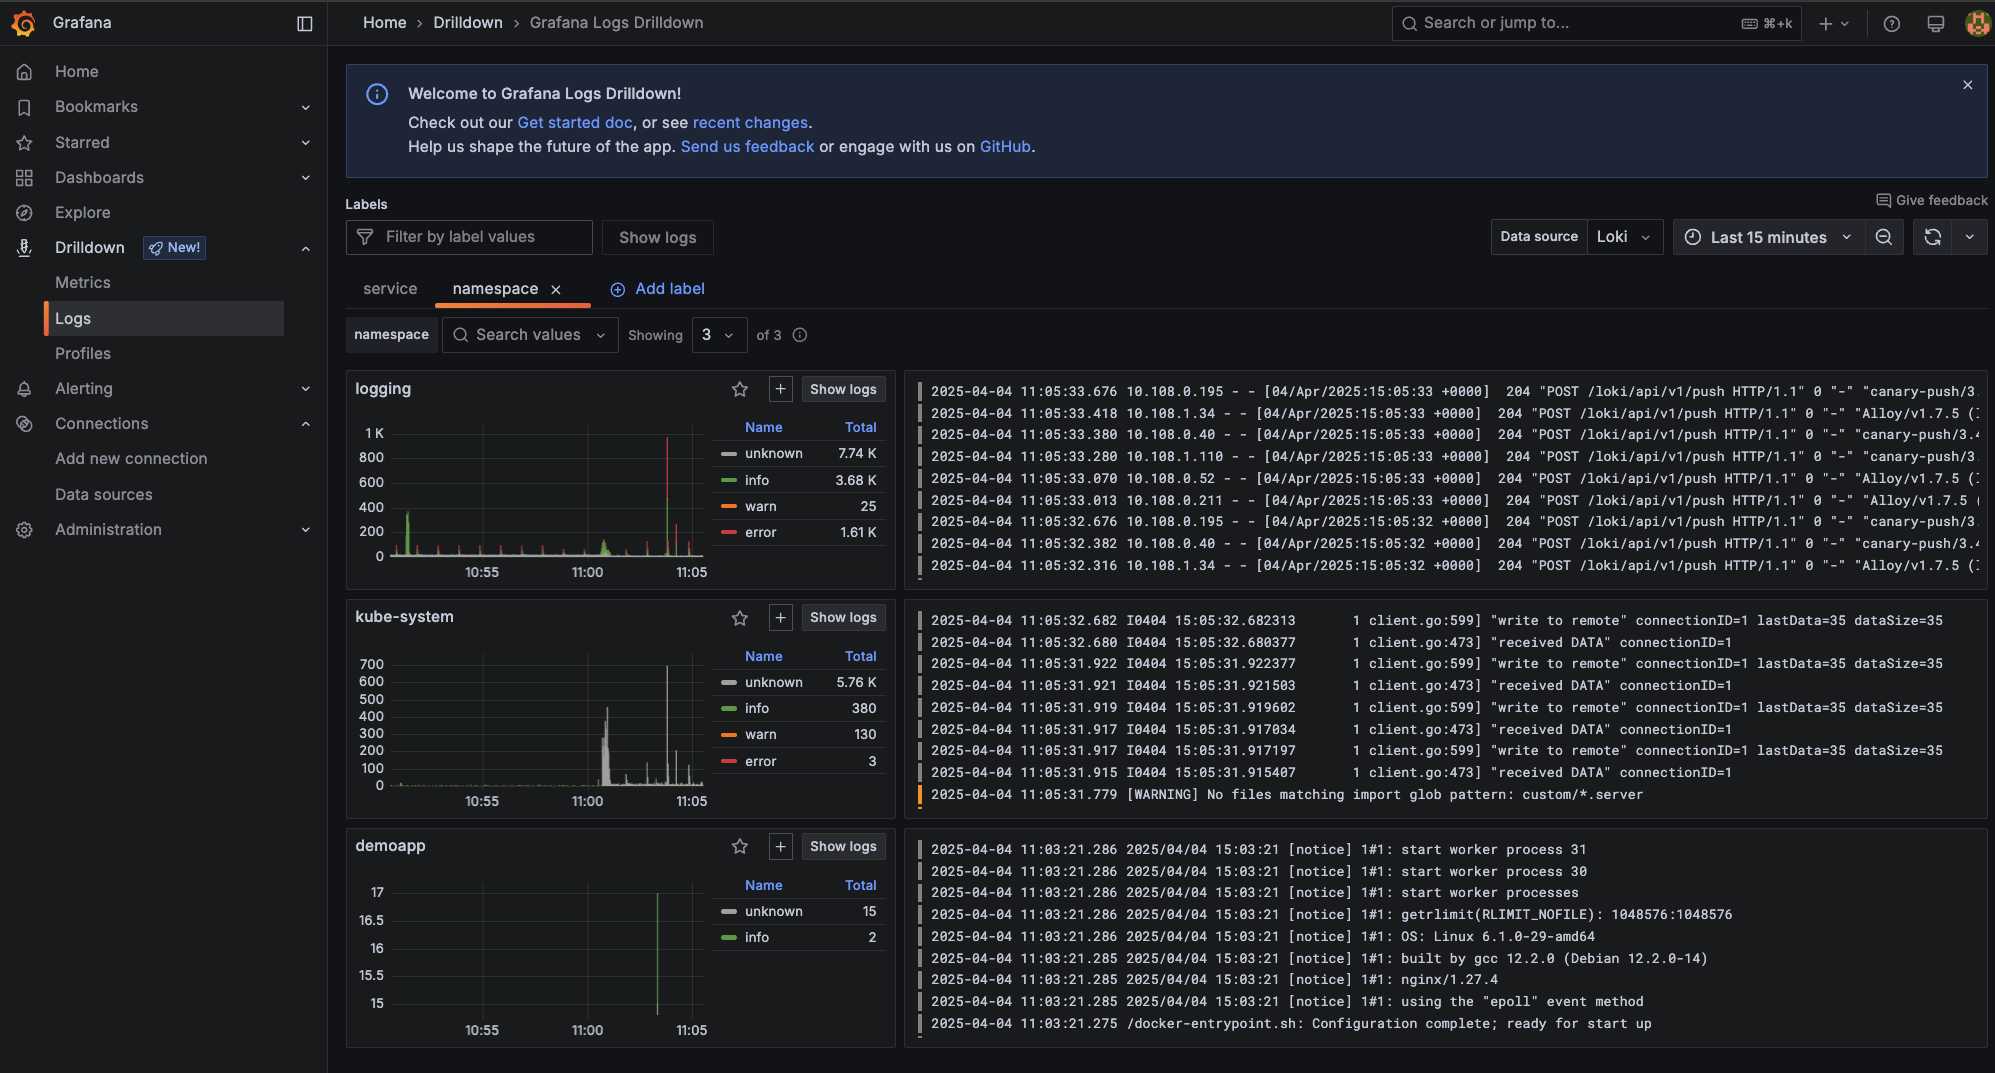
You can select any namespace, for example, demoapp
Whichever the path you prefer, Explore or Drilldown, Grafana lets you save any query screen as panels in a new or existing dashboard. This provides an easy way to revisit frequently used queries and monitor logs over time.
In this tutorial, you learned how to set up a robust logging stack with Grafana, Loki, and Alloy on Kubernetes, deploying and configuring each component using Helm. You prepared the Kubernetes environment, installed all three logging components, configured Loki to use AWS S3 for storage, and finally saw how to access the logs in Grafana using practical query examples.
While setting up a logging stack can be time-consuming, there are alternative solutions that can simplify logging and monitoring. For example, mogenius is a cloud-agnostic platform that provides developer-friendly monitoring with instant access to logs, status events, and resource usage metrics.
These tools create a comprehensive logging and monitoring stack that offers streamlined deployment, robust data visualization, and efficient log management. It enhances your ability to monitor, troubleshoot, and optimize Kubernetes environments.
Grafana Helm charts automate the deployment process, enabling a quick and seamless setup of Grafana dashboards in Kubernetes, reducing the complexity of manual configurations and updates.
Loki Helm charts provide a streamlined way to deploy Loki in Kubernetes, facilitating efficient log aggregation and management without the overhead of managing separate configurations.
Yes, both Loki and Grafana offer official Helm charts, available from repositories like the Helm Hub, which provide pre-configured templates to simplify and accelerate setup in Kubernetes environments.
Subscribe to our newsletter and stay on top of the latest developments
