
THE CHALLENGE
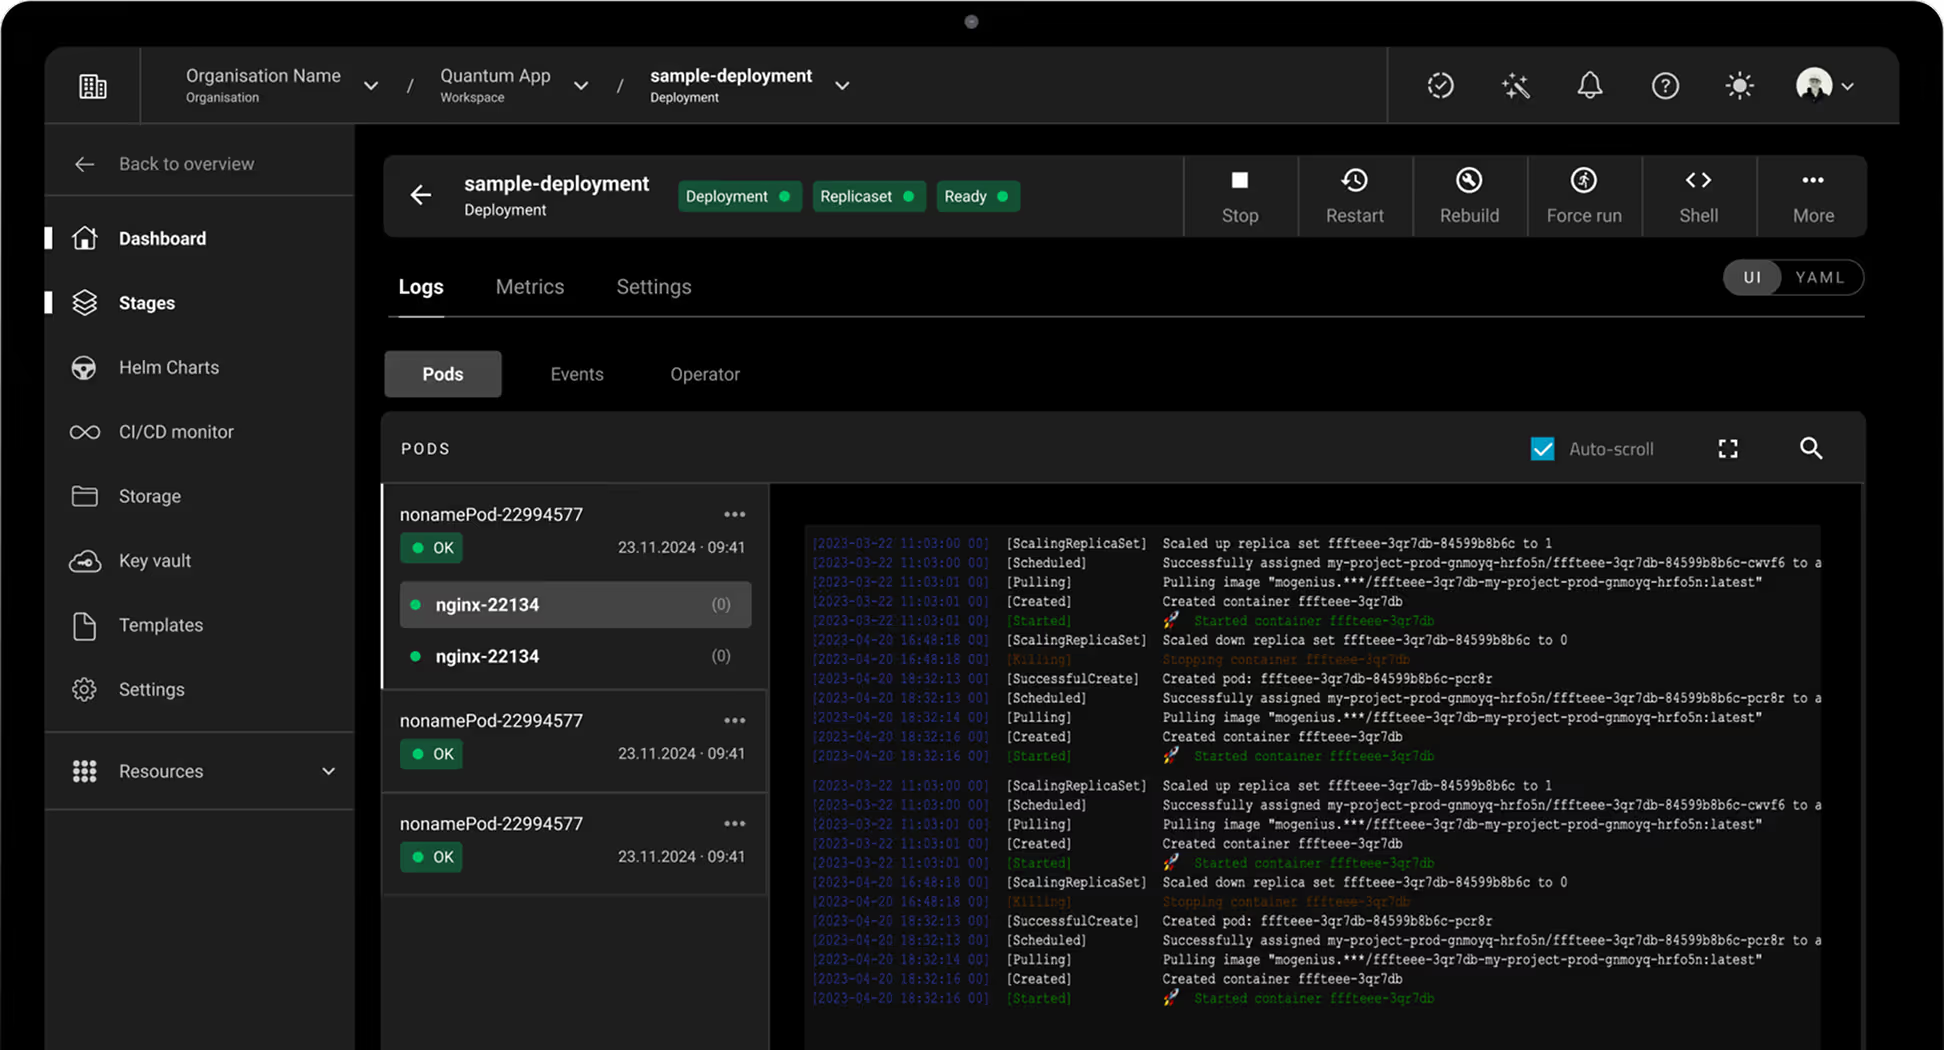
The Challenge: Kubernetes Monitoring at Scale
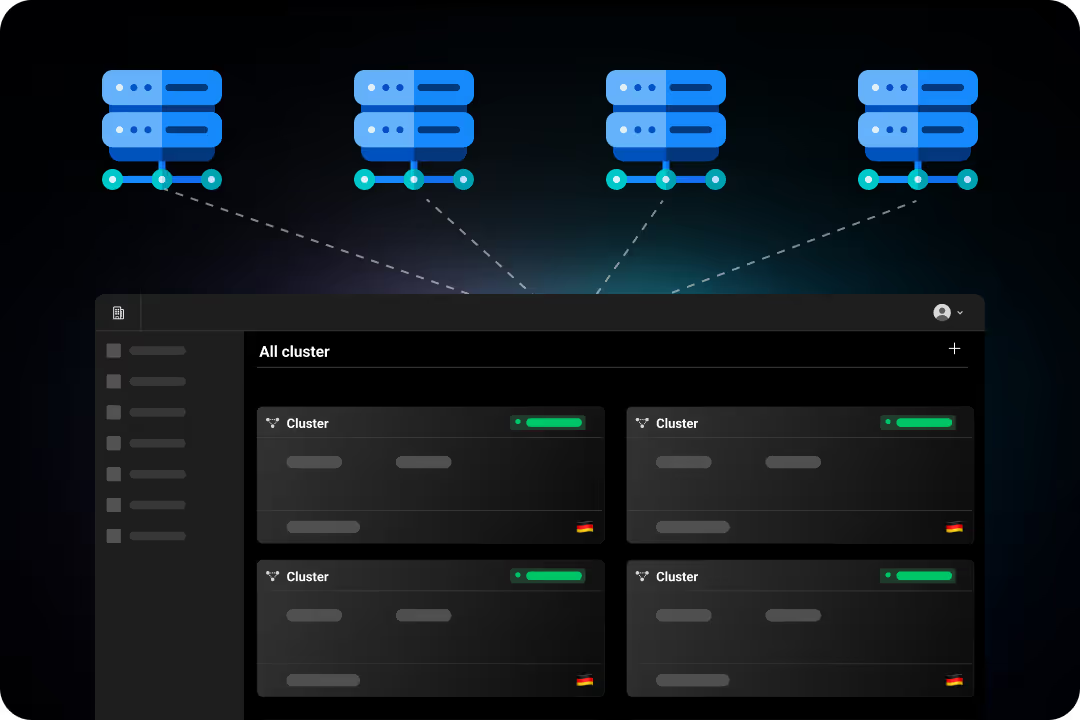
Kubernetes environments are powerful but notoriously complex. Multiple clusters, workloads, pipelines, and dependencies make it hard to
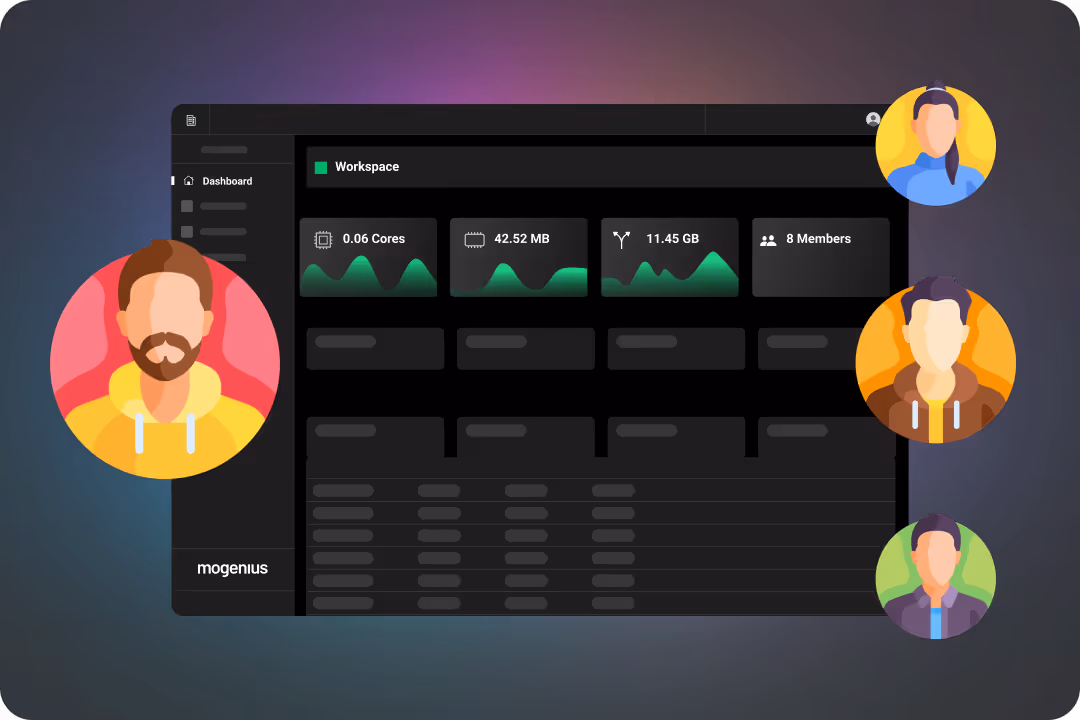
Set up monitoring across teams and clusters
Set up monitoring across teams and clusters
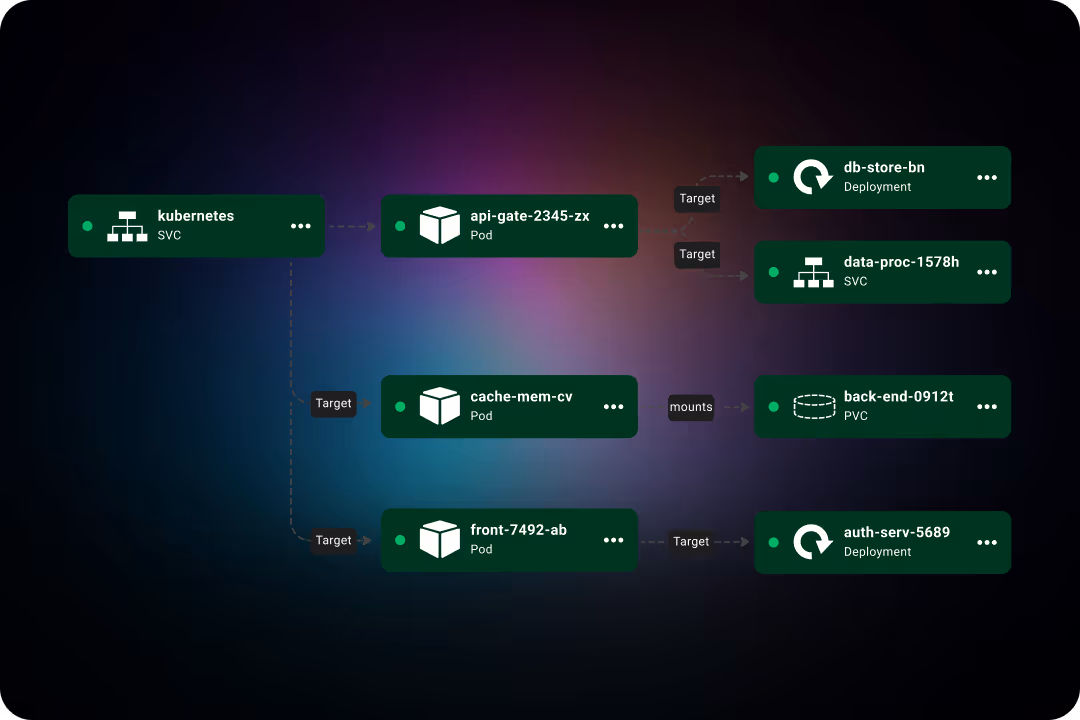
Correlate metrics, logs, and events
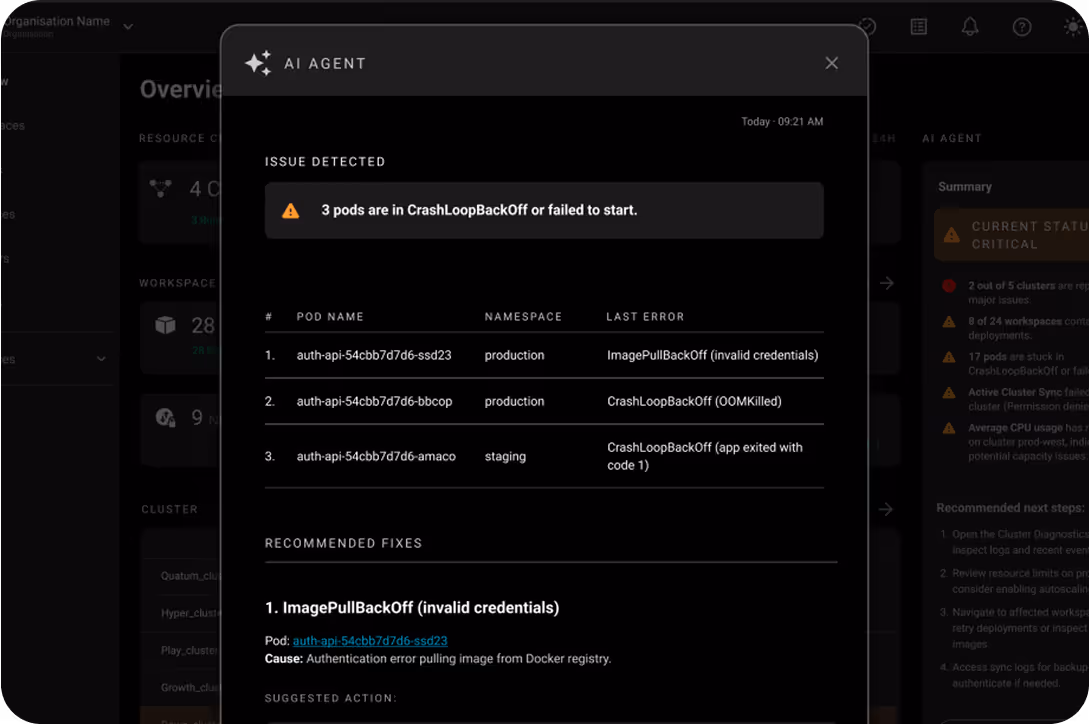
Detect issues early and resolve them quickly
mogenius solves this by unifying observability, automation, and troubleshooting into one intuitive platform.