
Editorial
-
-
Achieving Developer Self-Service with Internal Developer Platforms
Explore how internal developer platforms boost developer productivity and improve the developer experience through developer self-service.

Whether you’re a developer or a DevOps engineer, this guide will help you hone your troubleshooting skills, ensuring you’re prepared to tackle whatever issues arise in your Kubernetes environment.
Kubernetes troubleshooting requires a multifaceted approach. Here are some general solutions for all the challenges you might face:
kubectl logs, kubectl describe, and kubectl exec to inspect pods, services, and deployments.Now, let’s explore some of the common challenges you’ll face when troubleshooting in Kubernetes and their solutions.
Application failures in Kubernetes can be tricky to diagnose because they can stem from various issues—ranging from misconfigurations in your manifests to problems with the underlying infrastructure. Here’s how you can approach this challenge.
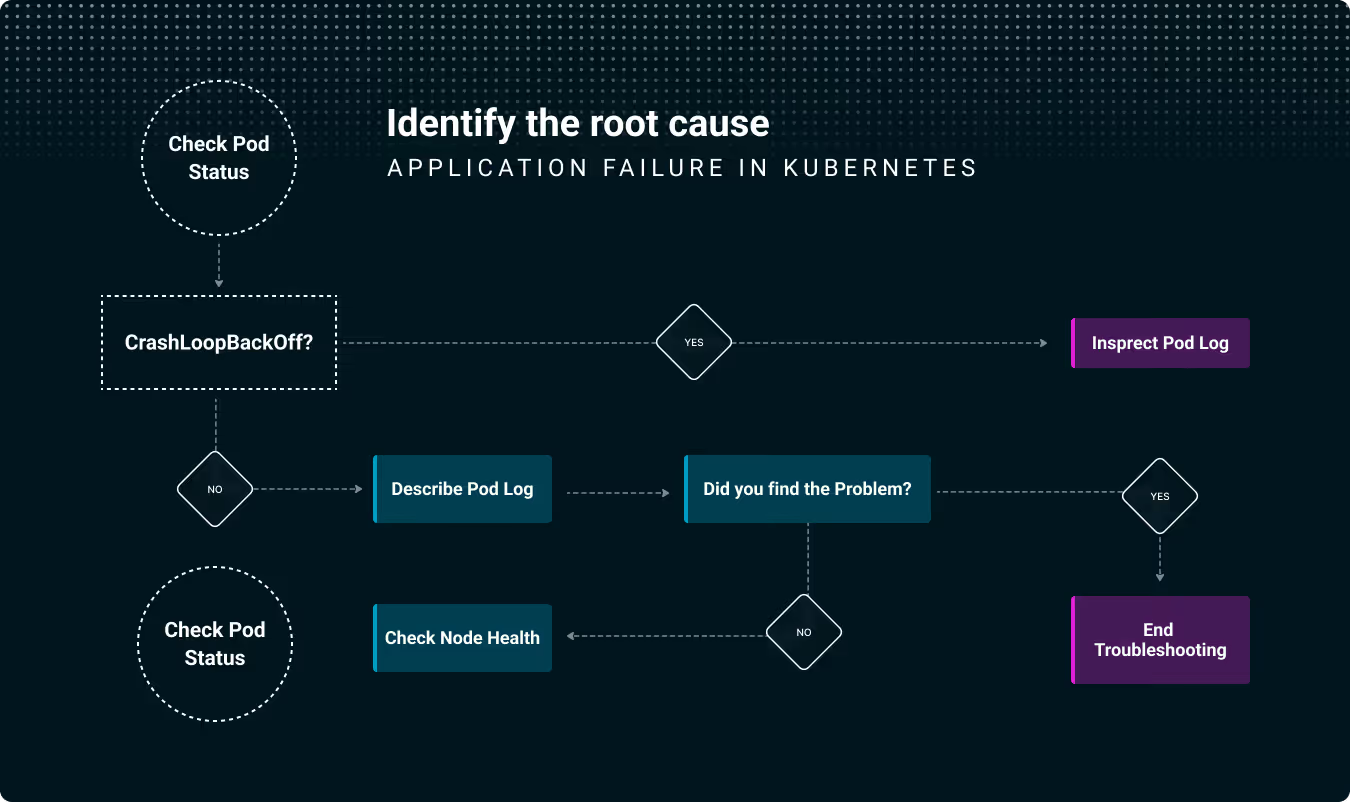
The first step is to check the status of your pods. Kubernetes provides a simple command to do this:
This command will list all the pods across namespaces and give you an overview of their statuses. Look for pods that are in a CrashLoopBackOff or Pending state.
If a pod is in a CrashLoopBackOff state, the next step is to inspect the logs for that pod. Use the following command:
The output will provide detailed logs from the container running inside the pod. Here’s an example of what you might see:
This log message suggests that your application is unable to connect to its database, which could be due to a misconfiguration in the service or a network issue.
If the logs don’t provide enough information, you can describe the pod to get more details about its status:
This command will display detailed information, including events that might indicate why the pod is failing. Look for events like FailedScheduling, which might indicate resource constraints.
Sometimes, the issue lies not with the pod itself but with the node it’s running on. Use the following command to check the status of your nodes:
If a node is in a NotReady state, it could be causing issues with the pods scheduled on it. You can describe the node for more details:
Logs are a critical component of troubleshooting, but in a Kubernetes environment, logs can be spread across multiple sources, making them difficult to manage and interpret. Here’s how you can approach this challenge.
One of the first things you should do is centralize your logs. Tools like Fluentd, or Logstash (also known as the ELK Stack) can aggregate logs from all your pods into a single location, making it easier to search and analyze them.
kubectl logs for Quick ChecksFor quick troubleshooting, you can use the kubectl logs command, as shown earlier. However, this only gives you the logs for a single pod, which might not be enough when dealing with issues that span multiple pods.
If you suspect that an issue is affecting multiple pods, you can use a log aggregation tool to search across all logs. For example, if you’re using the ELK stack, you can run a query like this:
kubernetes.namespace_name: "default" AND log: "error"
This query will return all logs containing the word "error" in the default namespace, allowing you to identify patterns or widespread issues.
Or you can use stern, which is a pretty cool tool and even easier to use than the ELK stack. stern is designed specifically for Kubernetes environments and allows you to tail logs from multiple pods in real-time, all from the command line. It aggregates logs from pods based on label selectors, making it extremely efficient for troubleshooting distributed applications. For instance, you can run stern <pod-name> and it will automatically retrieve logs from all the pods matching that name, handling dynamic pod scaling without any extra configuration. It supports color coding to distinguish logs from different pods, which can help identify patterns or track issues across pods visually. Unlike heavier log aggregation systems like the ELK stack, stern provides a lightweight and more immediate way to view logs, particularly useful during development and debugging sessions when you need instant insights without the overhead of complex setups.
Logs can quickly consume storage, so it’s essential to implement log retention policies. This ensures that you keep the logs you need for troubleshooting without overwhelming your storage resources.
apiVersion: v1
kind: ConfigMap
metadata:
  name: log-retention-config
  namespace: kube-system
data:
  retention.conf: |
    [Retention]
    Time = 7d
    Size = 1GB
If you’re interested in understanding the broader context of these challenges, take a look at this insightful piece on the state of cloud-native application development.
Performance issues can be some of the most challenging problems to troubleshoot in Kubernetes, especially when they manifest differently across environments (e.g., development, staging, production). Here’s how you can address this challenge.
Kubernetes provides several built-in tools for monitoring resource usage, such as CPU and memory. The kubectl top command is a quick way to check resource usage across your cluster:
kubectl top pods --all-namespaces
This will give you an overview of CPU and memory usage for all pods. Look for pods that are consuming unusually high resources.
For more detailed monitoring, consider deploying the Kubernetes Metrics Server and Prometheus. These tools provide real-time metrics that can help you identify performance bottlenecks.
You can deploy the Metrics Server with a simple command:
kubectl apply -f https://github.com/kubernetes-sigs/metrics-server/releases/latest/download/components.yaml
Once installed, you can use Prometheus to set up alerts and dashboards that track performance metrics across your environments.
Network issues can also cause performance problems. Tools like kubectl-trace and Weave Scope can help you analyze network traffic and identify bottlenecks.
Here’s an example of using kubectl-trace to trace system calls on a node:
kubectl trace run <node-name> -e syscalls
The output will show you detailed information about system calls, which can help you identify network-related issues.
Security is a critical concern in any Kubernetes environment, and it’s essential to address vulnerabilities and compliance issues promptly. Here’s how you can approach this challenge.
Kubernetes’ Role-Based Access Control (RBAC) is a powerful tool for managing permissions within your cluster. Ensure that you’re using RBAC to limit access to resources based on the principle of least privilege.
For more on Kubernetes security, read this article on Enhancing Kubernetes Security Through RBAC, Network Policies and Kubernetes Policies.
Regularly scanning your Kubernetes cluster for vulnerabilities is crucial to maintaining a secure environment. Tools like Trivy, Clair, grype, and Anchore can help you identify vulnerabilities in your container images.
Here’s an example of how to use Trivy to scan a Docker image:
trivy image <image-name>
The output will display any detected vulnerabilities, categorized by severity:
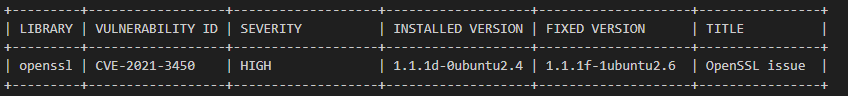
In this case, you can see that there’s a vulnerability in the openssl library that needs to be addressed. The output also shows the fixed version, so you know what to upgrade to.
Pod Security Policies (PSPs) allow you to define a set of security conditions that a pod must meet before it can be scheduled. While PSPs are deprecated in newer versions of Kubernetes, they are still useful in clusters where they are supported.
Compliance with industry standards such as PCI-DSS, HIPAA, or GDPR is often a requirement in production environments. Tools like Open Policy Agent (OPA) and Kyverno allow you to enforce compliance policies across your Kubernetes resources.
Additionally, the CIS Kubernetes Benchmark is one of the most important standards to follow. It provides best practices for securing Kubernetes cloud services, containers, databases, and so on and is often prioritized over other standards mentioned earlier. The CIS Benchmark covers areas like API server configurations, network policies, and pod security standards, offering a comprehensive guide to strengthening the security posture of your Kubernetes environment.
For instance, you can create an OPA policy that requires all pods to have certain labels:
package kubernetes.admission

violation[{"msg": msg}] {
  input.request.kind.kind == "Pod"
  not input.request.object.metadata.labels["environment"]
  msg := "All pods must have an 'environment' label."
}
This policy will deny the creation of any pod that doesn’t have an environment label, helping you maintain compliance with both CIS Benchmark recommendations and other organizational policies.
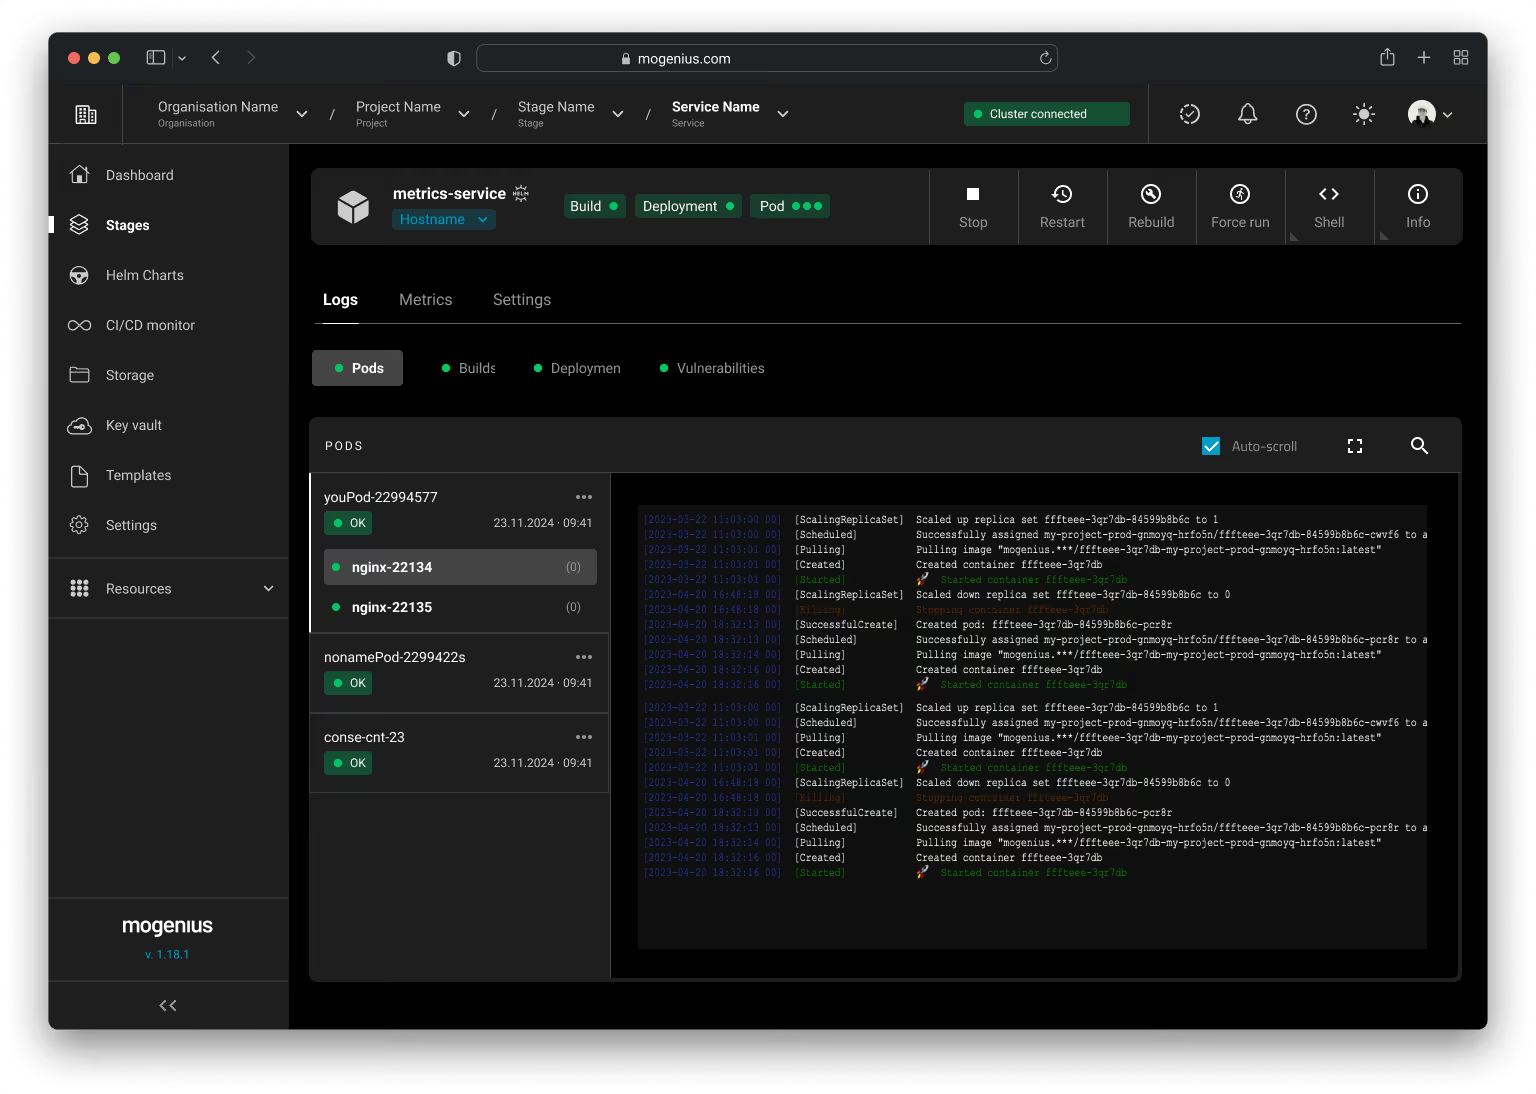
While empowering developers with self-service capabilities is a powerful strategy, it's essential to understand the unique challenges posed by modern cloud-native environments, particularly Kubernetes. The complexity of these systems introduces new hurdles in the troubleshooting process:
To address these challenges and implement effective troubleshooting, organizations can leverage self-service platforms like mogenius. These solutions bridge the gap between development and operations, providing developers with the tools and visibility they need to troubleshoot effectively in Kubernetes environments:
This approach not only improves efficiency but also fosters a culture of shared responsibility and continuous learning, bridging the traditional gap between development and operations in the age of Kubernetes and cloud-native applications.
When things go wrong in your Kubernetes environment, effective communication and collaboration are critical to resolving the issue quickly. Here’s how you can approach this challenge.
Before an incident occurs, it’s crucial to have a clear incident response plan in place. This plan should define roles, responsibilities, and procedures for handling incidents. Ensure that all team members are familiar with the plan and know what to do when an issue arises.
During an incident, quick and clear communication is essential. Tools like Slack, Microsoft Teams, or Mattermost can facilitate real-time communication among team members.
Consider creating dedicated channels for different types of incidents. This keeps communication organized and allows team members to quickly find relevant information.
As the incident unfolds, document everything. This includes:
Documentation is critical for post-incident reviews and helps improve your processes for future incidents.
After the incident is resolved, conduct a post-incident review. This meeting should include all involved parties and focus on understanding what went wrong, what was done well, and how to improve in the future.
Consider the following questions during the review:
Troubleshooting in Kubernetes can be challenging, but with the right mindset and tools, it becomes an opportunity to strengthen your environment. Each incident is a chance to gain insights into your systems and refine your processes. By approaching issues methodically, whether it's pinpointing root causes, managing logs, or addressing security gaps, you can get your applications back on track faster and more effectively.
As they say, adversity breeds growth — so with each challenge, your team becomes more prepared, more capable, and ultimately stronger. Just refine your processes and empower your team with self-service capabilities, and you will build a more resilient and responsive Kubernetes environment.
Subscribe to our newsletter and stay on top of the latest developments
